User Activity 👑
This tab is only available to Patreon T1+ supporters.
The User Activity feature provides comprehensive analytics on Warframe Market user engagement patterns, helping you understand peak trading times and market activity trends.
Chart Overview
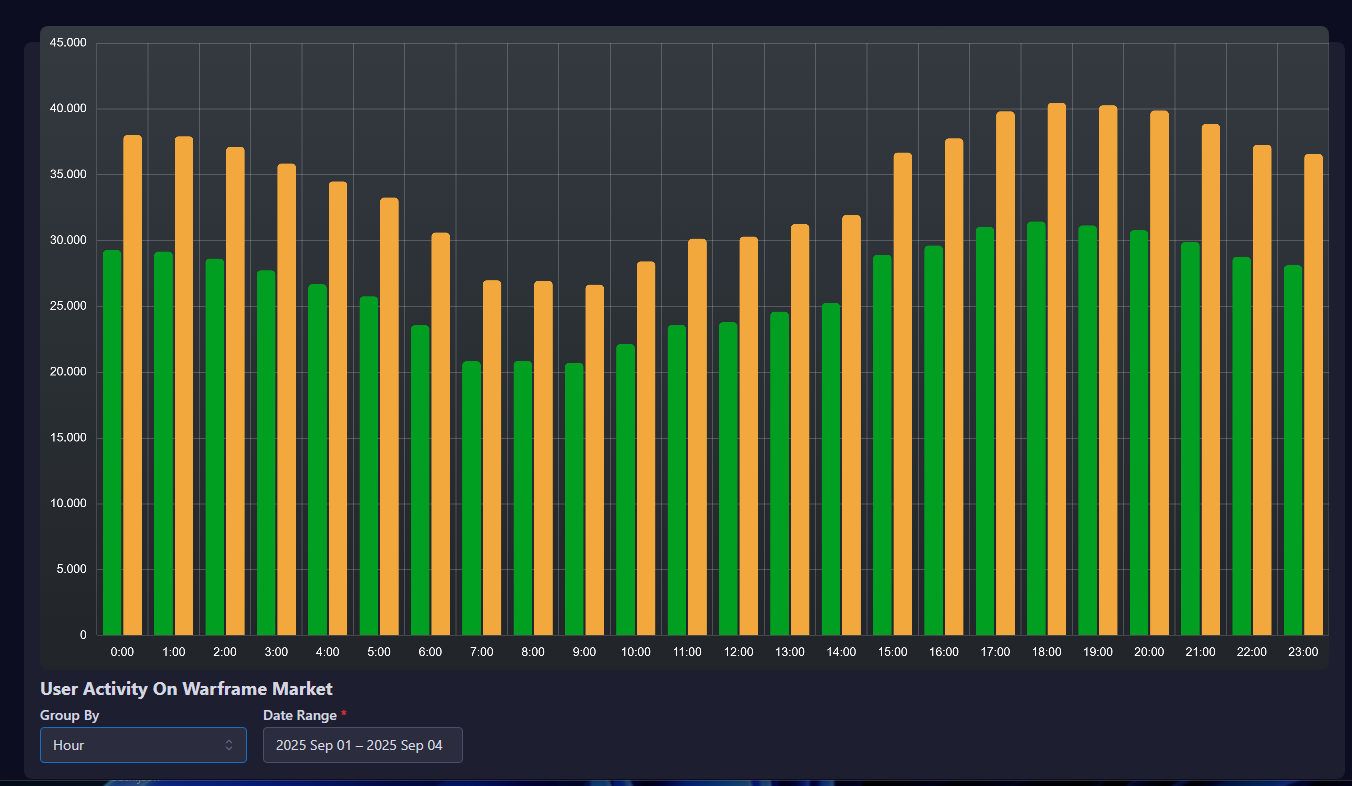
The main chart displays User Activity On Warframe Market with:
- Hourly Breakdown: Activity data grouped by hour (0:00 to 23:00)
- Dual Bar Display: Two different metrics shown in green and orange bars
- Time-based Analysis: Clear visualization of peak and low activity periods
- Date Range Selection: Customizable date range for historical analysis
Control Options
- Group By: Currently set to "Hour" for hourly activity breakdown
- Date Range: Selectable date range (shown example: 2025 Sep 01 — 2025 Sep 04)
- Interactive Chart: Hover and click functionality for detailed data points
Key Insights
- Peak Hours: Identify when most users are active on Warframe Market
- Trading Patterns: Understand optimal times for listing or buying items
- Market Trends: Track activity changes over different time periods
- Strategic Planning: Plan your trading activities during high-activity windows
Features
- Real-time Data Visualization: Live charts showing current user activity patterns
- Historical Analysis: View past activity data with customizable date ranges
- Hourly Granularity: Detailed breakdown of activity by hour of the day
- Comparative Metrics: Multiple data series for comprehensive analysis
- Interactive Controls: Easy-to-use filters and grouping options
- Market Intelligence: Gain insights into optimal trading times
- Export Capabilities: Save charts and data for further analysis